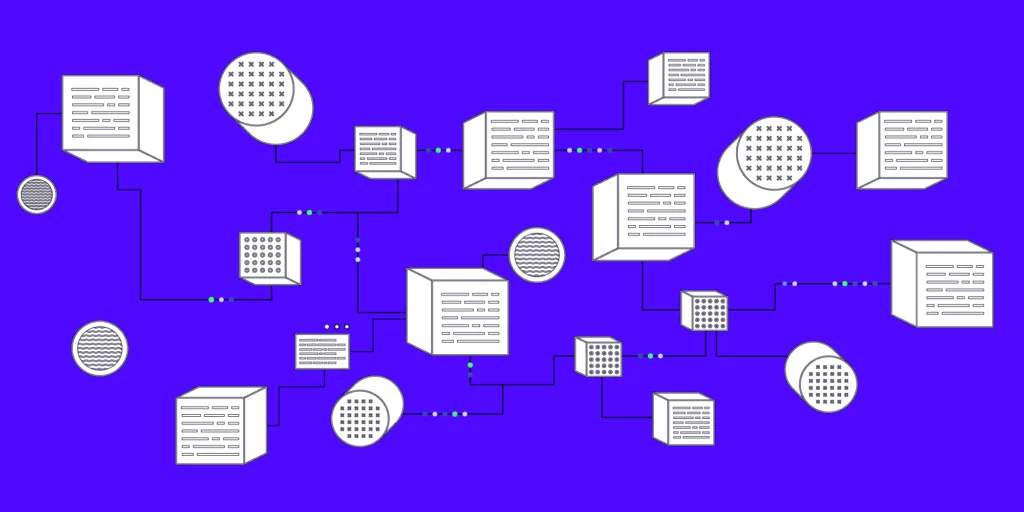
Microservice architecture typically involves multiple services communicating with each other over a network, often using different technologies and protocols. This can make it challenging to keep track of what’s happening across the system and to diagnose issues when they arise.
Introducing Monitoring and Observability
Monitoring and Observability are two essential practices when working with software development as it helps teams keep track of the system’s performance and health. It can be difficult to detect problems without monitoring or observability in a timely manner and identify the root cause of system issues.
Monitoring is the practice of collecting data from a system and displaying it in an organized manner, such as through logs or dashboards. This can be useful for tracking system performance and diagnosing issues quickly.
Observability is the practice of collecting data from a system and then analyzing it for patterns and insights. This can be useful for understanding how the system is behaving and diagnosing deeper issues.
Together, monitoring and observability help teams ensure that their microservice architecture is running efficiently and effectively. Today cloud providers all have their own monitoring tools, which are easy to set up and integrate with other cloud services, especially if you are running your microservices in their cloud. Additionally, there are a number of open-source monitoring and observability tools available, such as Prometheus and Grafana. Regardless of the tools you use, monitoring and observability are essential for keeping your microservice architecture running smoothly.
Monitoring
One of the most utilized monitoring tools is logs. We all have written logs since they are easy to implement and work well for most use cases. However, logs alone are not always enough, especially in complex microservice architectures. That’s why there are also specialized monitoring tools that provide additional insights into your system’s health, such as metrics and tracing. These tools can help you quickly identify and diagnose issues, and ensure that your microservices are performing optimally.
When writing logs it’s good practice to follow some rules of thumb;
- Include relevant context: Log messages should include relevant information about what happened, when and the severity level of the given log. A log message can also include any relevant details about the event or error.
- Be consistent: When writing error messages, define a style you follow with your team(s) across the microservices. This will make them easier to read and understand. This will also make it easier to use other tools to find relevant information when needed.
- Avoid unnecessary information: Logs should only include relevant information, as too much data can make it difficult to find the information you need.
- Use structured logging: Structured logging involves formatting log messages as key-value pairs or JSON objects, making it easier to search and analyze log data.
- Store logs centrally: As mentioned above, cloud providers have easy-to-use tools for storing logs centrally so that they can be easily accessed and analyzed by the team. Other tools can be used, for example, ELK stack, Splunk or Graylog, to name a few.
You might wonder, what is relevant context, what styles can I use across microservices etc.
Here is an example;
[2023-05-14 10:30:00] INFO: User [623] login successful.
[2023-05-14 10:30:25] INFO: User [2531] login successful.
[2023-05-14 10:45:00] WARN: User [623] trying to checkout order [524] without items.
[2023-05-14 10:48:10] ERROR: Cannot update user [2531]: PSQL Duplicate key found ON column 'email' with value ''.In the above example, we can clearly see when something happened, the severity and the log. In this example, our team has decided to use a standard for IDs, where they are encapsulated in brackets. i.e. [ID]. This helps us to decipher the messages faster, as our brains can quickly ignore these. In our error, we include information about what someone was doing when the error occurred, why it happened, and where the error is.
Side note: The error should probably be handled as it’s a validation error, and a system should not try to insert duplicate values into its database.
As an exercise I would like to encourage you to visit your logging system; Is there anything that can be improved?
An additional technique that ensures the health of your services is the use of metrics. When we talk about metrics, we are referring to a set of quantifiable measures or parameters that can be used to evaluate different aspects of your services. For instance, you can use metrics to track response times, error rates, and resource utilization. By analyzing these metrics, you can gain valuable insights into how your services are performing and identify areas that may require further optimization or improvement. Metrics can thus serve as an essential tool for enhancing the reliability and quality of your services, helping you to provide a better experience for your users while also mitigating the risk of outages, downtime, or other performance issues that could undermine your business operations.
Observability
As mentioned above, observability is the practice of collecting data, through monitoring, and then analyzing it for patterns and insights. A subject that touches on both monitoring and observability is tracing.
Tracing
Tracing involves tracking the flow of requests through a system and can help teams to identify issues with individual services or dependencies between services. Tracing is particularly important in microservices, where services may be distributed across multiple servers and networks. Tracing provides a way to visualize the behavior of the system and can help to identify bottlenecks and other deeper issues.
One simple technique that can be used to aid in tracing is to include a unique identifier in each log message that is related to a specific request or transaction. This identifier can be used to correlate log messages across multiple services, providing a trace of the flow of a request through the system. For example:
[2023-05-14 10:30:00] INFO: REQ[256]: User [623] login successful.In addition to adding unique identifiers to log messages, there are also specialized tools that can be used to implement tracing in a microservice architecture. These tools, known as distributed tracing systems, allow teams to visualize the flow of requests through the system and to trace issues across multiple services. Some popular distributed tracing tools include OpenTelemetry, Jaeger, and Zipkin.
Alerts
Another way to ensure the health of your system is to implement alerts. Alerting involves setting up notifications to alert teams when certain conditions are met (such as a service becoming unresponsive or a spike in error rates). Effective alerting is critical to ensuring that issues are identified and addressed quickly before they can impact users or other parts of the system.
When implementing Alerts, here are some tips to keep in mind:
- Define clear thresholds: Alerts should be triggered when certain conditions are met, such as a CPU usage exceeding a certain percentage or an error rate increasing beyond a certain threshold. These thresholds should be clearly defined and based on the requirements of the system.
- Use multiple notification channels: Alerts should be sent through multiple notification channels, such as email, SMS, and chat, to ensure that team members are notified in a timely manner.
- Prioritize alerts: Not all alerts are created equal. It’s important to prioritize alerts based on their severity and impact on the system so that team members know which alerts to respond to first.
- Use actionable alerts: Alerts should provide clear information about what action needs to be taken, such as restarting a service or rolling back a deployment.
- Create runbooks: Runbooks are documents that provide detailed instructions for responding to specific alerts. Creating runbooks can help ensure that team members know what steps to take when an alert is triggered.
- Test alerts regularly: Alerts should be tested regularly to ensure that they are working as expected and that team members are receiving notifications.
- Analyze alert data: Alert data can provide valuable insights into the health of the system. By analyzing alert data over time, teams can identify patterns and trends that may indicate underlying issues that need to be addressed.
By following these tips, teams can ensure that alerts are effective in helping them to identify and respond to issues in their microservices architecture.
Visualization
What happens when non-technical people want to understand a system? Or when the team wants to visualize the metrics of their system? Visualization is a great tool for presenting data about the system in a way that is easy to understand and interpret. Effective visualization can help you to quickly identify patterns and issues in the data and to make informed decisions about how to optimize performance and address issues.
There are several tools that can be used for visualization when implementing monitoring and observability in your microservice architecture. Here’s a list to name a few:
- Grafana: Grafana is an open-source platform for creating and sharing dashboards and visualizations. It supports a wide range of data sources, including popular Monitoring and Observability tools like Prometheus, Graphite, and Elasticsearch.
- Kibana: Kibana is an open-source data visualization platform that is often used with Elasticsearch. It provides a range of visualization options, including charts, graphs, and maps.
- Tableau: Tableau is a commercial data visualization platform that provides a range of advanced features for creating interactive dashboards and visualizations.
I have worked with Grafana myself, and it has been great! The learning curve isn’t that steep and the features it packs should work for any small to medium size project. However, when implementing visualization, there are several things to keep in mind:
- Choose the right visualization for the data: Different types of data require different types of visualizations. For example, time-series data may be best represented using line charts, while geographic data may be best represented using maps.
- Keep it simple: Visualizations should be easy to read and understand. Avoid cluttering dashboards with too much information, and use colors and labels judiciously.
- Provide context: Visualizations should include context that helps viewers understand the data being presented. This could include labels, titles, and annotations.
- Use interactive features: Interactive features such as drill-downs, hover-over tooltips, and filtering can help viewers explore the data and gain deeper insights.
- Update visualizations in real-time: Real-time updates can help teams respond quickly to changes in the system. Tools like Grafana and Kibana support real-time updates, allowing visualizations to be updated automatically as new data becomes available.
By following these best practices, teams can create visualizations that help them to gain insights into the behavior of their microservices architecture and to make informed decisions about how to optimize performance and address issues.
Summary
Microservice architecture can make it challenging to diagnose issues when they arise. Monitoring and observability are two essential practices that help teams keep track of the performance and health of a system. Monitoring involves collecting data from a system and displaying it in an organized manner, while observability involves collecting data and analyzing it for patterns and insights. Together, these practices help ensure that microservice architecture is running efficiently and effectively. Popular monitoring and observability tools include logs, metrics, tracing, alerts, and visualization tools like Grafana and Kibana. Subjects that we did not cover in this post are SLOs, SLAs, SLIs, and error budgets. These are concepts I suggest you explore on your own.
Resources:
Grafana
Kibana
Tableau
Prometheus
Learn about SLAs, SLOs, and SLIs.
Part 1: The Pros and Cons of Microservices: Is It Right for Your Project?
Part 2: Building a Robust Microservice Architecture: Understanding Communication Patterns
Part 3: The Importance of Monitoring and Observability in Microservice Architecture
Part 4: Securing a Microservice Architecture – 5 Pillars
Part 5: Testing in Microservices: Ensuring Quality and Reliability


